Project #9 Data Potrait
Description
A data portrait of how many times I touched my phone in 7 days.
Design Process
I know a lot of people rely on their mobile devices just like I do. So I start to wonder if I track down go want times I touched my phone in a week. I break the seven days into different interactive games based on how many times I touched my phone that day.
Day 1: I created a snake game for you to play to see how many times I touched my phone that day. The fruit number is the actual amount
Day 2: The number of bubbles are the times I touched my phone and you can click to the bubble to see the actual number.
Day 3: I used snowflakes representing that I looked at my phone a lot that day (with a little exaggeration). Try to see the actual text.
Day 4: Move your mouse to have some interaction with the canvas and bubbles changing randomly on the vertical row are the times I touched my phone. If you look closly in the middle, you will see the actual number.
Day 5: Same with day 2 but the bubble will act differently than day 2.
Day 6:The bubble sorting are the number of times I touched my phone.
Day 7: Same with day 4 but the bubbles changing randomly on the horizontal column are the times I touched my phone. If you look closly in the middle, you will see the actual number.
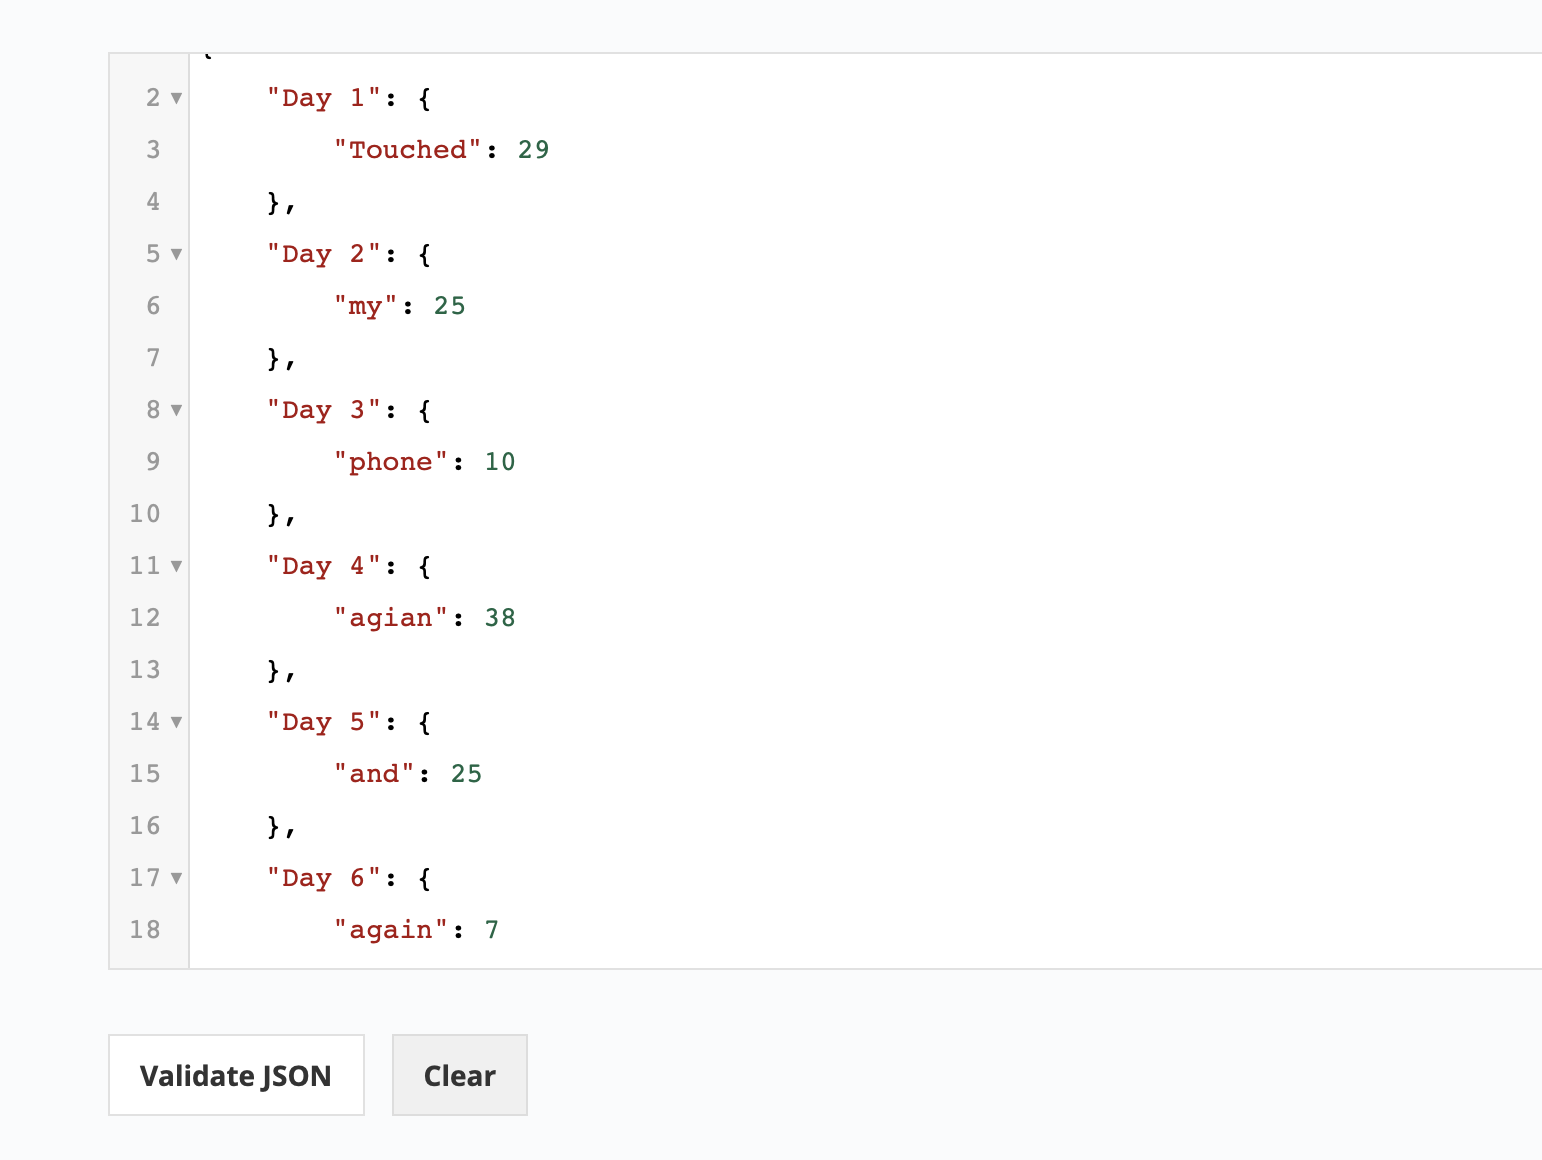
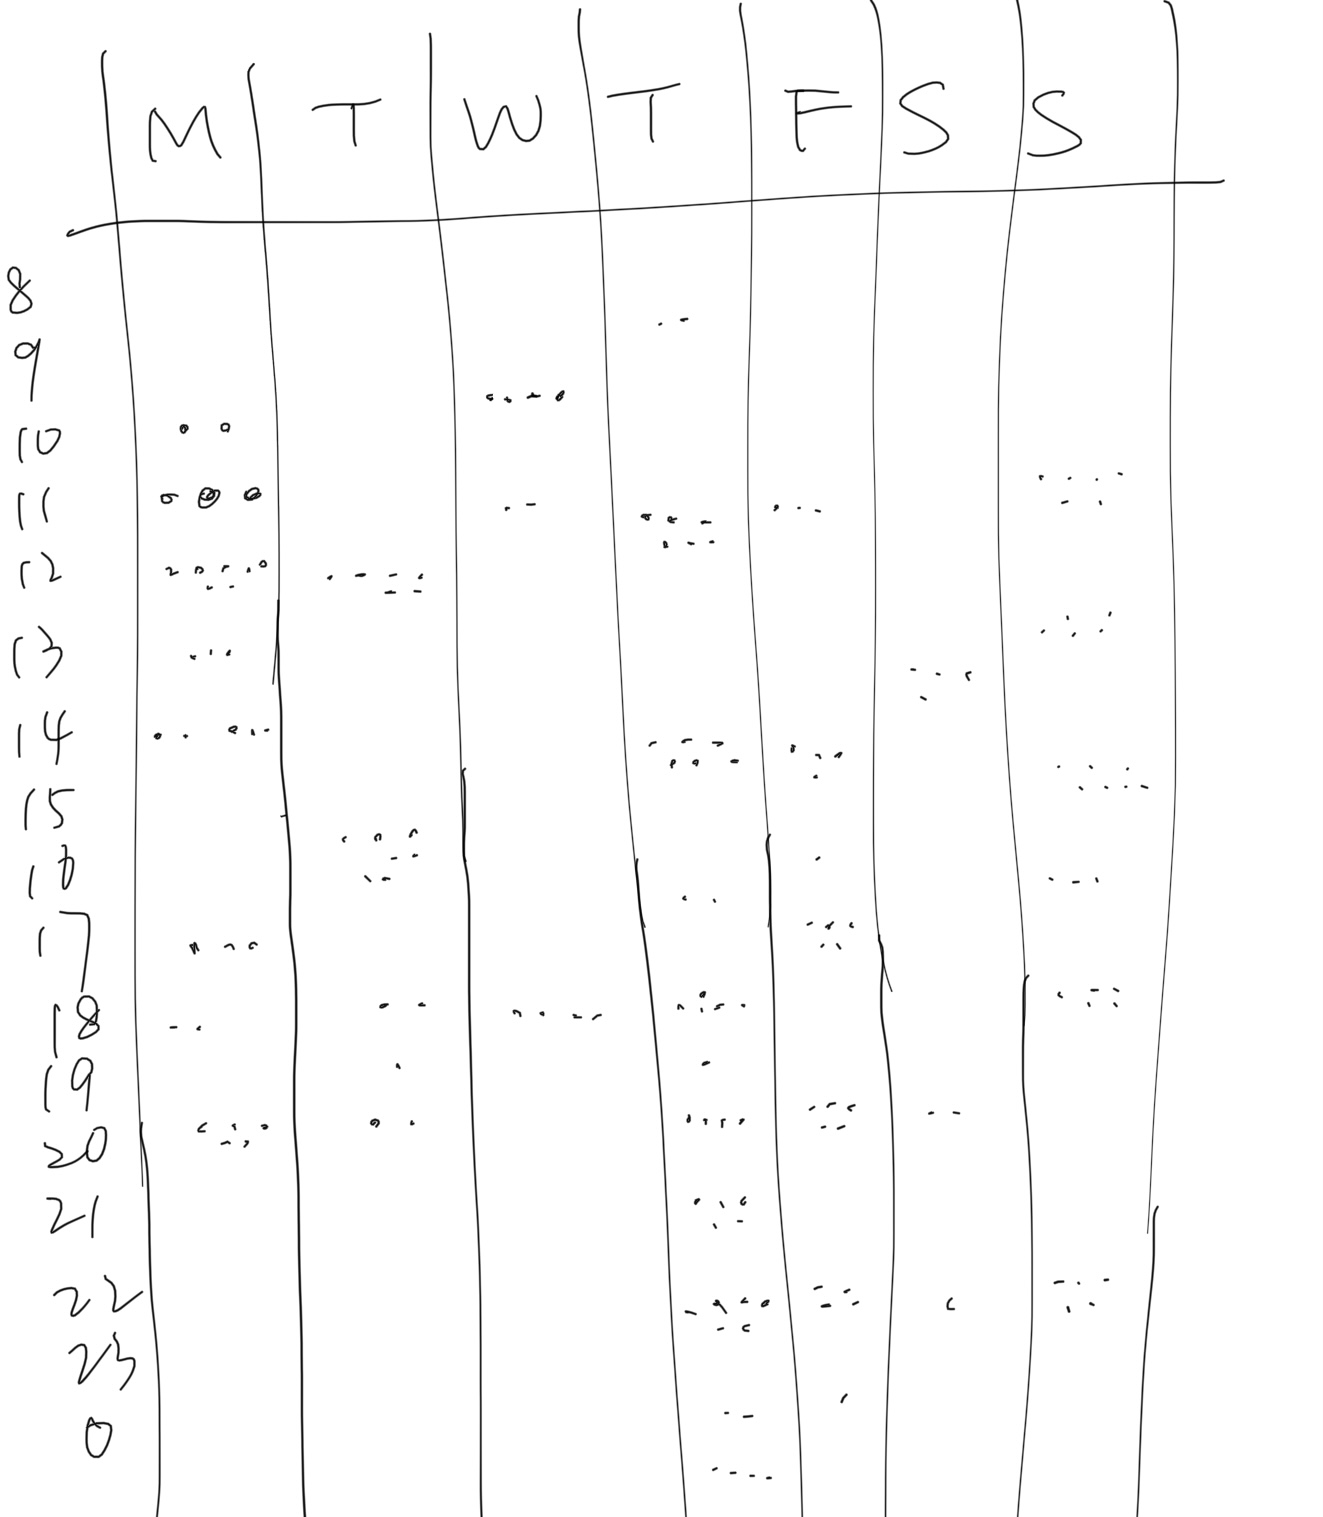
Down below is my JSON file and data record:
Reflection
With the self-tracking, I really see that how phones are embedded in every little scenes in our life. During this process of data visualization, I try to focus more on the actual touching part instead of playing our phones because our mobile devices are something that we can’t live without these days. Picking phones or touching it becomes a habit and it is changing our daily life, becoming an essential part of our life. What we don’t know is the harm and we are missing out a lot besides the phone. This addiction is slowly changing us and withdrawal our relationship with friends and family and the things happened around us.